Here is a basic summary of all available garbage collectors.
Collector Block the world (minor) Block the world (major) Threads (minor) Threads (major) -XX:+UseSerialGC Yes Yes 1 1 -XX:+UseParallelGC Yes Yes Multiple 1 (*1) -XX:+UseConcMarkSweepGC Yes No 1 (*2) Concurrent (*3) |
*1 (use -XX:+UseParallelOldGC for parallel compaction)
*2 (use -XX:+UseParNewGC to enable a parallel young generation GC. Don’t add -XX:+UseParallelGC with this option)
*3 (1 thread uses one processor)
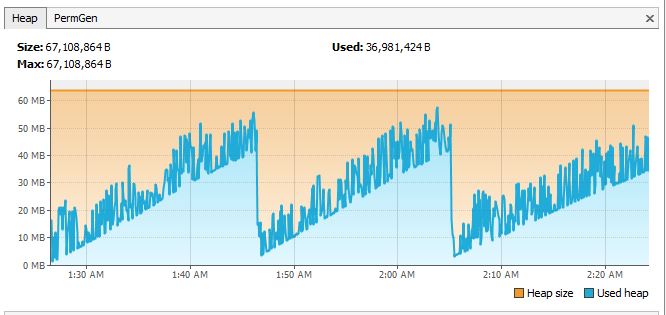
Simple GC Test
String a = null; while ( true ) { a = new String(" <some really long string> "); } |
Hmmm.. Over time, its seems to be growing. And notice GC going into panic mode and doing a major memory sweep. Whats happening here is a FULL GC. Meaning the tenure generation was full and the JVM went through the full heap to to garbage collect. Major collection or Full GC happens when the tenure generation is full and needs collection.
What is this format of verbose GC log?
[GC [PSYoungGen: [Before size of youngGen]K -> [After Size of youngGen]K ([Total size of young Gen]K) ] [ Before size of totalHeap]K -> [After size of totalHeap]K ([Total size of totalHeap]K), Time Elapsed secs ] [Times: user=0.00 sys=0.00, real=0.00 secs]
Ok, this is the first micro collection. Lets analyze this.
[GC [PSYoungGen: 16448K->1568K(19136K)] 16448K->1576K(62848K), 0.0023509 secs] [Times: user=0.00 sys=0.00, real=0.00 secs]
62848K is total heap memory allocated.
19136K is total youngGen memory allocated.
youngGen came down by 14880K
however fullHeap came down by 14872K
What happened to 8K?
There were probably some objects in the minor generation that got moved to the old generation. Eventually the tenure space is going to less and less space which will trigger a full gc. Here is the stackoverflow answer for this. According to sackoverflow answer, “As for your test case, the String objects will never go in Old Generation. They will at most survive 1 GC cycle and go to a Survivor space, and then will be reclaimed” “There are at least 20 other threads running in the JVM, not only your “Main” Thread, so it is quite logical that some objects are created.”.
Lets analyze a FullGC
[GC [PSYoungGen: 20800K->608K(21056K)] 63720K->43992K(64768K), 0.0024890 secs] [Times: user=0.00 sys=0.00, real=0.00 secs]
[Full GC [PSYoungGen: 608K->0K(21056K)] [ParOldGen: 43384K->1599K(43712K)] 43992K->1599K(64768K) [PSPermGen: 7457K->7312K(21248K)], 0.0088368 secs] [Times: user=0.09 sys=0.00, real=0.01 secs]
youngGen came down by 608K
however fullHeap came down by 41785K
clearly, the reduction in full heap is due to clearance of memory in tenure space.
When is the GC called?
The JVM will decide that. You can use System.gc() but its not guaranteed that the GC will be called.
What objects are eligible for GC?
Lets take an example! (I got this from http://stackoverflow.com/questions/3299604/interview-question-objects-eligible-for-garbage-collection). How many objects will be scheduled for GC before //Some other code?
class A { B b; A easyMethod(A a){ b = new B(); a = null; // the reference to a2 was passed in, but is set to null // a2 is not set to null - this copy of a reference is! return a; // null is returned } public static void main(String [] args){ A a1 = new A(); A a2 = new A(); A a3 = new A(); // There are 6 active objects, a1, a2, a3 and respective objects of B in each of these. a3 = a1.easyMethod(a2); // a3 set to null and flagged for GC (see above for why). So is the 'b' in a3. // When parent;s reference is set to null, child or contained object automatically becomes eligible for garbage collection. a1 = null; // so far, a1 and a3 have been set to null and flagged (so are 'b''s within them). // Some other code } } |
In few words, how does garbage collection occur?
The most straightforward garbage collection algorithms simply iterate over every reachable object. Any objects left over are then considered garbage. The time this approach takes is proportional to the number of live objects, which is prohibitive
Memory divided into generations? What, Why?
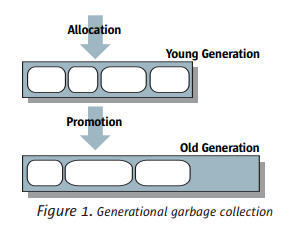
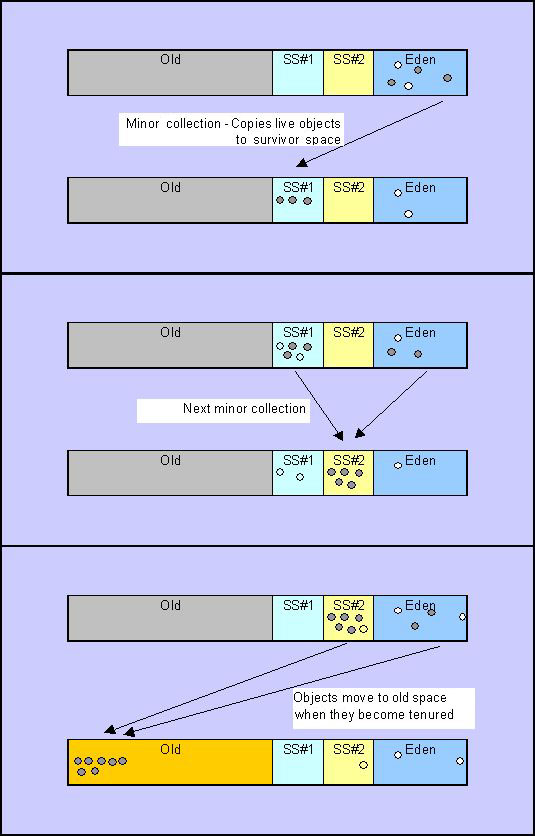
Memory is divided into generations. Why? Because typically different objects live for different duration. Full GC’s loop through all live objects that take a long time. The idea is to garbage collect certain sections of live memory more often. Many objects can be reclaimed (i.e., have “died”) shortly after being allocated. Some objects do live longer. Basic premise is divide memory into young and old generation, allocate all memory initially in the young gen. Garbage collection starts from young gen (which takes lesser time and happens more often) and graduate objects to old gen (if they’re yet alive). When you garbage collect in young gen, you potentially loop through lesser objects, and you reclaim most of them.
Minor collections (or young gc collection) can be optimized assuming the weak generational hypothesis (states that most objects survive for only a short period of time) holds and most objects in the young generation are garbage and can be reclaimed. The costs of such collections are, to the first order, proportional to the number of live objects being collected; a young generation full of dead objects is collected very quickly. Eventually, the tenured generation will fill up and must be collected, resulting in a major collection, in which the entire heap is collected. Major collections (or tenure gc collection) usually last much longer than minor collections because a significantly larger number of objects are involved.
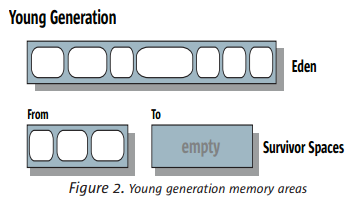
Most objects are initially allocated in Eden (a few large objects may be allocated directly in the old generation). Survivor spaces hold objects that have survived at least one young generation collection and have thus been given additional chances to die. At any given time, one of the survivor spaces (labeled From in the figure) holds such objects, while the other is empty and remains unused until the next collection.
How are the two survivor spaces used?
If survivor spaces are too small, copying collection overflows directly into the tenured generation. If survivor spaces are too large, they will be uselessly empty.
General garbage collection concepts (not tied to JVM)
Mark and sweep is an algorithm used by the JVM to collect garbage. It goes accross the heap and checks which memory references and being referenced and marks them. An object is considered garbage when it can no longer be reached from any pointer in the running program. It goes across again and garbage collects all memory spaces that have not been marked. The time this approach takes is proportional to the number of live objects, which is prohibitive for large applications maintaining lots of live data. The mark-and-sweep algorithm does not address fragmentation (meaning holes in memory).
One way to deal with fragmentationis to shift memory into empty blocks. What happens too all pointers pointing to that memory location which got moved? you would need to update all pointers which is time consuming. Well, alternative is to use redirection (or double pointers). Your pointers will point to a memory space which will contain the address. You need to update just that address.
Stop-and-Copy Garbage Collection is another GC method which uses double the memory but avoids fragmentation. You need to provision two chunks of equal memory. Start by allocating memory in the first chunk. Lets say it gets fragmented. Now copy all the memory from first chunk into second chunk (when you copy all the memory will get de-fragmented) and keep allocating memory in the second chunk. Now assume even that gets fragmented. Repeat! Survivor spaces in young generation use this technique.
How does JVM garbage collector allocate space?
Allocation occurs using a simple technique called bump-the-pointer. The end of the previously allocated object is always kept track of. When a new allocation request needs to be satisfied, all that needs to be done is to check whether the object will fit in the remaining part of the generation and, if so, to update the pointer and initialize the object.
What about multi-threaded garbage collectors? Synchronizing on the pointer will be very time comsuming. Here comes in the use of Thread-Local Allocation Buffers(TLABs). Each thread its own buffer (i.e., a small portion of the generation) from which to allocate. Since only one thread can be allocating into each TLAB, allocation can take place quickly by utilizing the bump-the-pointer technique, without requiring any locking. Only infrequently, when a thread fills up its TLAB and needs to get a new one, must synchronization be utilized. Because there are multiple garbage collector threads there is a small possibility of fragmentation. Reducing the number of garbage collector threads will reduce this fragmentation effect as will increasing the size of the tenured generation.
What are different performance metrics for JVM?
Throughput which is the percentage of total time not spent in garbage collection, considered over long periods of time. Garbage collection overhead which is the % of total time spent in garbage collection. Pause time is the length of time during which application execution is stopped while garbage collection is occurring. Footprint is the total memory that the application occupies on the computer. Promptness is how quickly the object is garbage collected, after it becomes dead.
They are in some sense opposing goals. For example, 1.) a very large young generation may maximize throughput, but does so at the expense of footprint, promptness and pause times. 2.) the parallel garbage collector would help with throughput over response time, as compared to a concurrent garbage collector which would help with response time over throughput. 3.) A small footprint might be the main concern of an application running in a mobile phone.
Describe few JVM parameters for the GC?
-Xms Minimum space
-Xmx maximum space
The difference is the ‘virtual’ part in the memory. By default, the virtual machine grows or shrinks the heap at each collection to try to keep the proportion of free space to live objects at each collection within a specific range. I suggest if you can spare memory just keep them equal. Setting -Xms and -Xmx to the same value increases predictability by removing the most important sizing decision from the virtual machine. However, the virtual machine is then unable to compensate if you make a poor choice.
In anycase you can decide in what range would the heap be sized.
-XX:MinHeapFreeRatio=40
-XX:MaxHeapFreeRatio=70
If total (allocated) heap is less than 40% free, then its increased (subject to the maximum size of the generation).
If total (allocated) heap is more than 70% free, then its decreased (subject to the minimum size of the generation).
-XX:NewRatio=3 means that the ratio between the young and tenured generation is 1:3. In other words, the combined size of the eden and survivor spaces will be one fourth of the total heap size.
-XX:SurvivorRatio=6 sets the ratio between eden and a survivor space to 1:6. In other words, each survivor space will be one sixth the size of eden, and thus one eighth the size of the young generation (not one seventh, because there are two survivor spaces).
Please explain he serial collector?
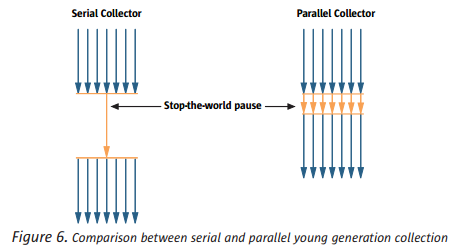
The serial collector (-XX:+UseSerialGC) uses a single thread to perform all garbage collection work, which makes it relatively efficient since there is no communication overhead between threads. It is a stop the world collector. Without an explicit choice by the user the serial garbage collector was always chosen. The serial collector is usually adequate for most “small” applications (those requiring heaps of up to approximately 100MB on modern processors). An example of a situation where the serial collector is not expected to be the best choice is a large application that is heavily threaded and run on hardware with a large amount of memory and a large number of processors.
Young GC (or minor) garbage collection with serial collector.
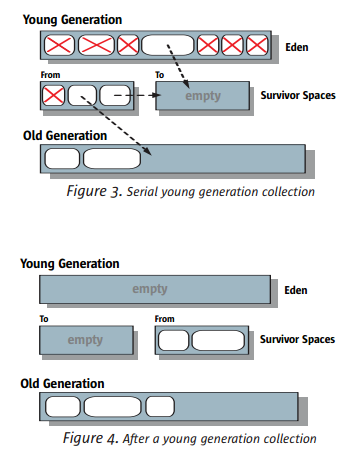
Old GC (or major collection) using serial collector. It consists of a mark & sweep, then a compaction step for de-fragmentation.

Please explain he parallel collector?
The parallel collector (-XX:+UseParallelGC) also known as the throughput collector performs minor collections in parallel (using multiple threads), which can significantly reduce garbage collection overhead. It is a stop the world collector. The parallel collector uses a parallel version of the young generation collection algorithm utilized by the serial collector.
By default, old generation garbage collection for the parallel collector is done using the same serial mark-sweep compact collection algorithm as the serial collector.
Parallel compaction (or the Parallel Compacting Collector) is a feature introduced in J2SE 5.0. Without parallel compaction major collections are performed using a single thread, which can significantly limit scalability. Parallel compaction is enabled by adding the option -XX:+UseParallelOldGC. On a machine with N processors (-XX:ParallelGCThreads=
How does Parallel Compacting Collector work?
1. Each generation is logically divided into fixed-sized regions.
2. Marking phase, mark all live objects in parallel. Update data for the region where live data resides with the size and location of the object.
3. The Summary phase operates on regions. Due to compactions, it is typical that left side will be dense, containing mostly live objects. There is less scope to recover space from such dense regions. Aim of this phase is to find a point where the space that could be recovered from a region and those to the right of it is worth the cost of compacting those regions. After finding such a point, regions to the left of that point are referred to as the dense prefix, and those regions will be untouched. The regions to the right of that point will be compacted, eliminating all dead space. The summary phase calculates and stores the new location of the first byte of live data for each compacted region. This is a serial phase.
4. Compaction phase, the garbage collection threads use the summary data to identify regions that need to be filled, and the threads can independently copy data into the regions.
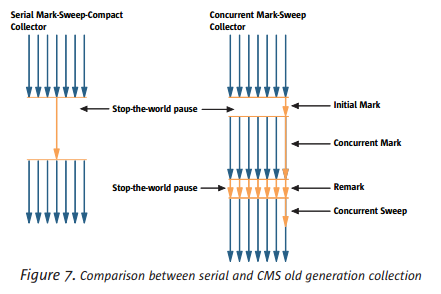
Please explain he concurrent collector?
The concurrent collector (-XX:+UseConcMarkSweepGC) performs most of its work concurrently (i.e., while the application is still running) to keep garbage collection pauses short. Used by applications that prefer shorter garbage collection pauses and can afford to share processor with the garbage collector. Response time is preferred over Throughput. The CMS collector collects the young generation in the same manner as the parallel collector (in particular, the application threads are stopped during minor collections). In addition to the use of processors during concurrent phases, additional overhead is incurred to enable concurrency. Thus while garbage collection pauses are typically much shorter with the concurrent collector, application throughput also tends to be slightly lower than with the other collectors. Since at least one processor is utilized for garbage collection during the concurrent phases, the concurrent collector does not normally provide any benefit on a uniprocessor (single-core) machine.
1. Initial mark, short pause that identifies the initial set of live objects directly reachable from the application code.
2. Concurrent marking phase the collector (concurrently) marks all live objects that are transitively reachable from this set. Remember, app threads are yet running while the concurrent gc is using one of the thread. Because the application is running and updating reference fields while the marking phase is taking place, not all live objects are guaranteed to be marked at the end of the concurrent marking phase.
3. Remarking phase which finalizes marking by revisiting any objects that were modified during the concurrent marking phase. Multiple threads are run in parallel to increase its efficiency.
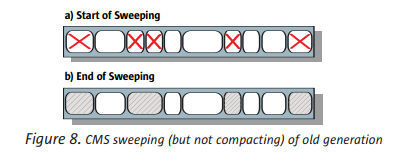
4. Concurrent sweep phase reclaims all the garbage that has been identified. The CMS collector is the only collector that is non-compacting.
How does concurrent garbage collector deal with fragmentation?
It doesn’t. The collector can no longer use a simple pointer indicating the next free location (bump-the-pointer technique). Instead, it now needs to employ free lists. As a result, allocations into the old generation are more expensive than they are with a simple bump-the-pointer technique.
Concurrent Mode Failure?
Other old generation garbage collectors kick off whenever tenure gen is full. However, CMS collector is proactive, it attempts to start a collection early enough so that it can complete before that happens. Otherwise, the CMS collector reverts to a stop-the-world mark-sweep-compact algorithm used by the parallel and serial collectors. This is known as a Concurrent Mode Failure.
Floating Garbage?
While the remark phase is going on (which is a concurrent activity) there might be some objects that become dead while tracing is going on. They wont be marked alive, and are known as floating garbage. This phenomenon is seen only in the concurrent mark and sweep algorithm.
When does the concurrent collector kick in?
A concurrent collection needs to be started at a time such that the collection can finish before the tenured generation becomes full; otherwise the application would observe longer pauses due to concurrent mode failure.
1. Let JVM take the decision based on some dynamic estimates.
2. A concurrent collection will also start if the occupancy of the tenured generation exceeds an initiating occupancy, a percentage of the tenured generation. The default value of this initiating occupancy threshold is approximately 92%. -XX:CMSInitiatingOccupancyFraction=
What is Incremental Mode in CMS?
Incremental Mode could be used if response time is important and you dont have too many processors. Incremental mode solves this problem by breaking up the concurrent phases (that use one processor) into short bursts of activity, which are scheduled to occur mid-way between minor pauses.
What is Ergonomics?
Ergonomics means choosing JVM parameters depending on machine characteristics.
MaxGCPauseMillis as a hint to the parallel collector that pause times of n milliseconds or less are desired. -XX:GCTimeRatio=19 sets a goal of 1/20 or 5% of the total time in garbage collection.
GCTimeRatio is interpreted as a hint that pause times of
If you specify the Xms and Xmx at different values Generation Size Adjustments occur to adjust the size of the heap. Growing and shrinking the size of a generation is done by increments that are a fixed percentage of the size of the generation so that a generation steps up or down toward its desired size. If not otherwise set on the command line, the initial and maximum heap sizes are calculated based on the amount of memory on the machine.
Q. Where is a static method and a static variable stored in java. In heap or in stack memory
http://stackoverflow.com/questions/8387989/where-is-a-static-method-and-a-static-variable-stored-in-java-in-heap-or-in-sta
What is The Garbage-First Garbage Collector?
The G1 collector is a server-style garbage collector, targeted for multi-processor machines with large memories. It meets garbage collection (GC) pause time goals with high probability, while achieving high throughput.
Following are links are some good reads on JVM. Also some of the above diagrams have been taken from these sites.
http://www.petefreitag.com/articles/gctuning/
http://chaoticjava.com/posts/parallel-and-concurrent-garbage-collectors/
http://java.dzone.com/articles/java-performance-tuning
http://www.javaworld.com/javaworld/jw-01-2002/jw-0111-hotspotgc.html
http://www.javacodegeeks.com/2012/12/java-thread-retained-memory-analysis.html
http://javabook.compuware.com/content/memory/how-garbage-collection-works.aspx
http://www.brpreiss.com/books/opus5/html/page414.html#SECTION0014000000000000000000
http://www.oracle.com/technetwork/java/javase/gc-tuning-6-140523.html
http://www.oracle.com/technetwork/java/javase/tech/memorymanagement-whitepaper-1-150020.pdf
http://www.javaworld.com/javaworld/jw-01-2002/jw-0111-hotspotgc.html